

The Labyrinth of Six Sigma Tools
Six Sigma is a widespread improvement method that uses a variety of tools to optimize processes. This multitude of tools is assigned to the phases in the DMAIC cycle. If one looks at the relevant literature, this leads to confusion regarding the assignment of the individual tools to the phases. Which tool should be used in which phase? A quantitative content analysis by researchers at Koblenz University of Applied Sciences provides support with the help of a hit list.


Six Sigma is a method for improving quality in companies. Deviations from the target value are to be reduced through a data-based, detailed process analysis. In order to apply Six Sigma, to reduce the variation in the process and to achieve the given specifications, various tools are required.
Introduce the DMAIC cycle
In order to achieve process improvements, the so-called DMAIC cycle is used in Six Sigma projects. Companies go through the five phases Define, Measure, Analyze, Improve and Control and use different tools in the respective phases. [2]
In the define phase, the project is first described and the problem that is to be eliminated is addressed. Furthermore, the action limits of the project are defined. The Measure phase deals in particular with the collection of data and its presentation by means of diagrams. Through this graphical processing, the first correlations between data become visible. In addition, the goal of the Measure phase is to quantify the extent of the problem in the form of a process capability analysis, for example. In the Analyze phase, the process and the previously collected data are analyzed. The analysis is intended to find the cause of the problem so that the next phase can be used to find a solution. The goal of the subsequent Improve phase is to generate and implement solutions for the previously analyzed causes of the problem. Finally, the results of the previous steps are validated in the Control phase and the solutions are integrated into the process flow. The goal of this last phase is to ensure the sustainability of the project results. [1]
The first step in implementing Six Sigma in a company is to develop training materials for employees or to seek external assistance. In the relevant literature, however, a large number of tools are presented for the implementation of Six Sigma improvement projects. Different authors recommend the use of a wide variety of tools, some of which are used in different phases. The assignment of tools to the phases of the DMAIC cycle is not consistent. 3] This can lead to confusion, as it is not clear to newcomers which tool is to be used in which phase. A summarizing overview of the tools most commonly used in the literature with the assignment to the respective phases does not yet exist.
Therefore, this study aims to summarize the most popular tools and how they fit into the DMAIC cycle to help companies apply the Six Sigma methodology.
Analysis of the technical literature
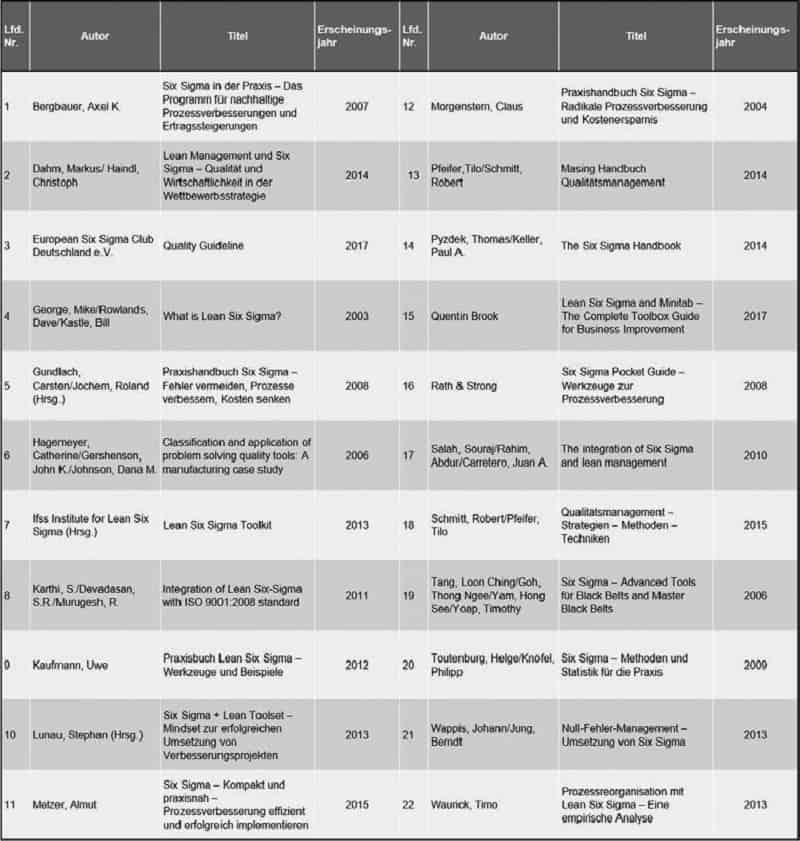
The relevant German and English-language specialist literature was used to conduct the study. The study is based on the 22 international popular specialist books and articles dealing with the topic of Six Sigma shown in Table 1.
Quantitative content analysis, which originates from empirical social research and is used for the quantitative descriptive analysis of texts, was used for the analysis. 4] The literature was searched for an assignment of the tools to the phases of the DMAIC cycle. It was found that only a few authors made such an attribution. When reviewing the literature, it should be noted that tools are sometimes referred to in different ways. For this reason, synonyms were grouped together and taken into account in the content analysis. A prime example of the multiple designation of a tool is the cause-effect diagram, which is also known as the Ishikawa or Fishbone diagram. Furthermore, in the quantitative content analysis, supercategories were occasionally formed, such as "slides for data presentation" or "creativity techniques". These were then subdivided again into the individual tools of the corresponding category.
In order to summarize the most popular tools and their classification in the DMAIC cycle, a top 5 hit list was created with the most widely used tools for each phase (Table 2). The list of top 5 tools per phase serves as a tool for companies. It provides a reference point for the implementation of a Six Sigma project and supports the selection of the right tools in the respective phase.
Results of the study
As can be seen in Table 2, the Define phase is characterized by a strong agreement between the authors. The tools SIPOC, VOC, project order and CTQ are thus clearly assigned to the define phase. They serve as tools for basic project and problem description. Other tools frequently used in the define phase are stakeholder analysis and the Kano model.
The use of the same tools in the Measure and Analyze phases is particularly striking. In the Measure phase, diagrams for data representation are created based on 17 reference books/articles. In particular, the histogram as well as the boxplot and Pareto diagram were frequently mentioned by the authors in this respect. The use of diagrams is also recommended in the Analyze phase, where the focus is also on the boxplot and Pareto diagram. Hypothesis tests are found in the Analyze phase. Analysis of variance, t-test and chi-square test are particularly emphasized. These assignments show that the tools used in the Measure phase focus on identifying problems and in the Analyze phase on identifying the causes of the problem.
While there is a great deal of unanimity among the authors in the first three phases of the DMAIC cycle, opinions are divided regarding the tools to be used in the Improve and Con trol phases. This could be a sign that the focus is predominantly on the Define, Measure and Analyze phases. Recommended tools in the Improve phase include creativity techniques, with a particular focus on brainstorming overall. In the Control phase, slides are also used for data representation. However, these are limited in particular to the use of control charts to control the process.
In summary, it is found that tools are not assigned to only one phase of the DMAIC cycle. In particular, diagrams for data representation are used in all phases and can be found in three phases in the top 5 hit list. The assignment of the Ishikawa diagram is also ambiguous, as the specialist literature refers to both the Measure and Analyze phases. Another example of this is statistical planning. Although it is only found in the hit list of the Improve phase, it occupies seventh place in the Analyze phase with nine hits.
The results of the study provide companies applying Six Sigma with an overview of which tools are used in which phases of the DMAIC cycle. Particularly for companies that are using this methodology for the first time, the list represents an aid that can be used to obtain an initial overview. This hit list was tested by three cross-industry Six Sigma projects in companies by students in the context of the Green Belt training. It was shown that the tools mentioned could be applied in the respective phases. The students thus saved themselves time-consuming literature research. Only a familiarisation with the respective tools was necessary.
It should be noted, however, that the tools are not applied rigidly according to the hit list. This merely serves as an overview of the tools most frequently found in the literature, but does not say whether their use is sensible for one's own project. Therefore, the usefulness of a tool for a project may vary depending on the topic or problem. Before using a tool, it should first be checked whether this tool seems to make sense for the project. The hit list thus offers a starting point for putting one's own training materials and the Six Sigma roadmap in the company to the test and making modifications.

