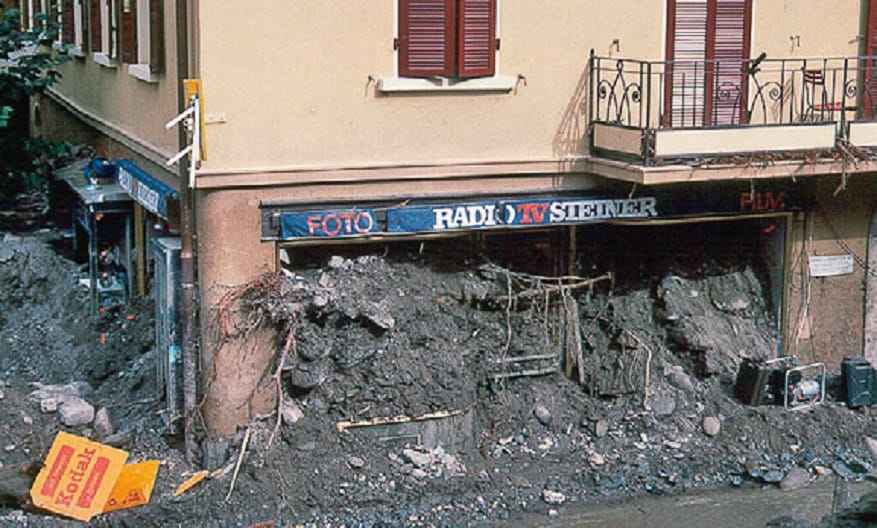
Global disasters: Assessment and countermeasures
Extreme events take their toll: More than seven trillion US dollars in economic damage and millions of deaths are the result of natural disasters between 1900 and 2015. The current record of geophysicist James Daniell of the Karlsruhe Institute of Technology (KIT) shows more than socio-economic indicators to lead an accurate disaster management in extreme times.

The CATDAT database developed by James Daniell draws on indicators that primarily help governments and aid organisations to carry out the most accurate disaster assessment possible. In 2016, Daniell received one of three PhD prizes from the Karlsruhe Institute of Technology KIT for his work. At the annual meeting of the European Geosciences Union in Vienna, the researcher commented on specific damage events.
According to the study, one third of the total economic damage between 1900 and 2015 was caused by floods. Earthquakes cause 26 percent of the damage, storms 19 percent, and volcanic eruptions account for only one percent. "Over the past hundred years, economic losses from natural disasters have increased per year - in absolute terms," says Daniell, who conducts research at KIT's Geophysical Institute as well as at the Cen - ter for Disaster Management and Risk Reduction Technology CEDIM and is a John Monash Scholar.
While flood disasters are the largest cause of economic losses over the entire period, in the more recent past, since 1960, the largest share (30%) is attributable to storms (and storm surges). - In relation to the respective value of infrastructure and buildings in a country (gross fixed assets), however, the losses decrease.
Vicious circle of underdevelopment
"Fundamentally, less developed countries are more vulnerable to disasters, meaning that relative to population size and wealth, more deaths and higher economic
In relation to the value of infrastructure or buildings, the loss amounts decrease.
damage than in more developed countries," says the geophysicist and civil engineer. One common reason is that the relevant building regulations are not implemented. In addition, as in Bangladesh, the coastal regions are the neuralgic centers. These are correspondingly densely populated.
For his analyses, Daniell relies on comprehensive socio-economic indicators such as.
- Population development
- Building fabric
- Consumer price indices Gross domestic products
- Capital stock
- Food safety data
In order to study the evolution of socio-economic vulnerability over time, he normalized the losses to 2015. "The clear trend here is that many countries are better protecting buildings against natural disasters, for example, thus reducing their risk of high losses," says Daniell.
Improved flood protection was having a clear impact, after very high losses, mainly due to flood disasters, had occurred between 1900 and 1960. A significant decline in economic losses has been observed in China and Japan since 1950, for example.
Depending on whether one adjusts losses to 2015 levels via the consumer price index or the construction price index, the global natural catastrophe loss balance since the beginning of the 20th century is between $6.5 trillion and $14 trillion. - The seven trillion calculated by Daniell is based on adjustment via a price index of gross domestic product (GDP deflator).
In the case of catastrophic events, research also assumes upper and lower limits.
"It is often impossible to get a more accurate figure for an event because damage is very difficult to estimate, even death tolls are often initially overestimated, for example in the 2010 Haiti earthquake, or underestimated, as in the 1966 Uzbekistan quake," he says, so he gives upper and lower limits in his research.
Greatest economic damage
In terms of the greatest economic damage, the year 2011 with severe earthquakes in Japan and New Zealand takes the top spot: "With 335 billion dollars in direct damage, the Tohoku earthquake with tsunami and nuclear accident on 11 March 2011 is the most expensive natural disaster to date," says Daniell. The quake and subsequent tsunami killed some 18,500 people and left 450,000 suddenly homeless.
Permanent earthquake risk
According to Daniell's data, the number of deaths from earthquakes between 1900 and 2015 is 2.32 million, with a range of variation from 2.18 to 2.63 million. Other findings: Most of the dead - 59 percent - died from destroyed brick buildings, 28 percent from secondary effects such as tsunamis and landslides. Volcanic eruptions killed 98,000 people during the same period (range: 83,000 to 107,000).
However, devastating volcanic eruptions before 1900, such as that of Tambora in 1815, can result in very high death tolls and global consequences, for example in terms of food security. James Daniell's conclusion: "The absolute number of annual deaths from natural disasters has fallen slightly over the years - in fact, it has fallen significantly in relation to population growth. Currently, it is around 50,000." Over the entire period (1900 and 2015), half of all victims died from flood disasters. Thanks to better preparation and analysis, this proportion is decreasing more and more. Since 1960, however, earthquakes have again taken a larger share at around 40 percent. Compared with the global mortality rate, the death toll from natural disasters has remained relatively constant. The strongest historically documented earthquake in Switzerland with a magnitude of about 6.6 occurred in Basel in 1356. Such events are to be expected about once within 1500 years. An earthquake with a magnitude of at least 5 occurs approximately every 8 to 15 years, while larger earthquakes with a magnitude of 6 or more occur in Switzerland every 50 to 150 years. Although very rare, they can happen in many places and at any time.


