

Develop routine in problem solving
If companies want to continuously develop and improve, then their employees must develop a routine in recognizing, analyzing and solving problems - so that changes are not only initiated and implemented top-down. A smart tool for achieving this goal is the A3 Report. It has proven its worth at Toyota, among others.


If companies want to embed a lean culture or culture of continuous change (CIP) in their organization, then their employees and work teams at the value-added level must learn to independently
- Identifying problems,
- analyse their causes,
- define measures to eliminate them,
- implement them consistently, and
- to derive new (behavioural) standards from this.
If employees do not have this competence, the establishment of a lean or CIP culture usually fails. Changes can only be initiated and implemented top-down.
Enable Lean and CIP culture
If communication is only done from the "top down", companies do not necessarily develop further in the increasingly networked market units. In addition, reaction times for problem solving may take too long.
Many projects that aim to establish a lean and CIP culture in companies fail not because employees and their managers lack the willingness to commit to the company's goals. Rather, the cause is that employees at the operational level lack the tools to implement the desired changes in parallel with day-to-day business.
Furthermore, there is no institutionalized process in the company to successively increase the competence of employees to independently recognize, analyze and sustainably solve problems. One instrument that fulfills this function is the A3 Report. It has proven its worth at Toyota, among others, as a strategy implementation as well as an organizational and personnel development tool.
A3 report with target: problem solving competence
The A3 report goes back to the industrial engineer Joseph M. Juran. In the 1950s, he recommended that Japanese top managers present problem solutions, decision-making principles and strategies on one sheet of paper for reasons of clarity. Toyota followed this advice and chose paper in DIN A3 format.
The A3 report is an instrument for solving problems. At the same time, however, it is intended to make the thought process involved in solving them transparent for employees by providing them with a template, so to speak, of the analysis and action steps to be taken when solving a problem.
In addition, the work with the A3 report should trigger a learning process in them that leads to a deeper understanding of the problems and gives them the competence to design sustainable solutions for them and to implement them in their everyday work.
The A3 report is based on the PDCA cycle known from lean management, according to which four phases are to be distinguished when solving problems:
Phase 1: "Plan". In it, the problem and the current state are described and the (core) causes of the problem are analysed. In addition, the target state is formulated. In addition, measurement parameters for the achievement of the target state are defined.
Phase 2: "Do". In it, the measures to achieve the target state are fixed.
Phase Three: "Check". This checks the effectiveness of the measures so that they can be readjusted if necessary.
Phase 4: "Act/Adjust". It evaluates the experience gained in the problem-solving process and derives standards for future action that will serve as a basis for further improvements.
Structure of an A3 report
These four phases can be found in the A3 reports. The form that serves as a basis for working with them contains text fields for the various analysis and work steps that need to be completed in a PDCA cycle. These can diverge depending on the application.
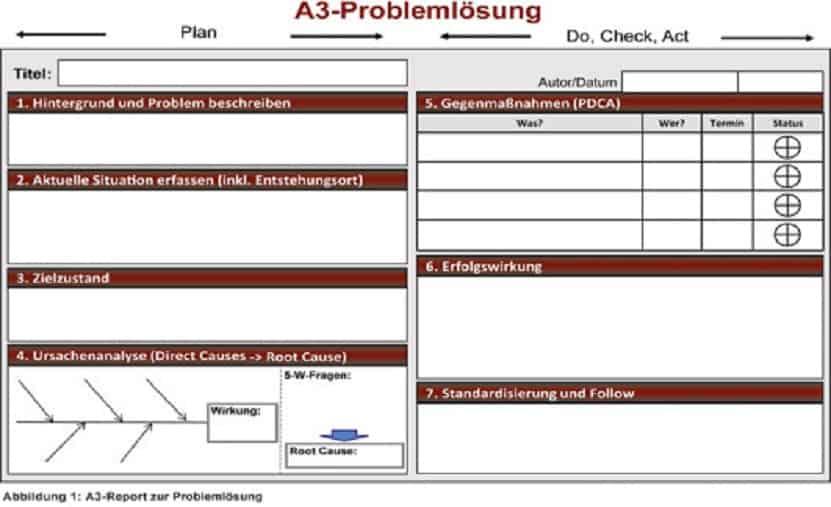
The A3 problem solving process consists of seven analysis and work steps. The first four are on the left side of the A3 form and refer to the planning phase. They describe the problem, the current situation and the goals. Below this, the core causes of the problem are also analysed. The right side reflects the Do, Check, Act phase (see Figure 1).
Above each A3 report is a title. It names the problem to be solved. This is followed by the seven analysis and work steps to be followed in solving the problem and implementing a new standard.
1. background The problem and its implications are described here. Two aspects in particular should be noted:
- The problem should be described in such a way that everyone involved in the process understands the problem and its implications.
- The description must show the relevance of the problem to be solved to the company's objectives.
2. current situation. Here we describe what is actually happening. In addition, it is important to identify the point of cause of the problem; furthermore, to analyse "at the scene" (Gemba) what is preventing those affected from achieving the target state. The actual state should be presented as simply and pictorially as possible. It is important to create a fact-based understanding of the problem among the report users. This is best achieved with graphics, diagrams and tables, etc....
3. target state The target state needs to be specified precisely for three reasons. First, thinking backwards from a target situation usually leads to stronger solutions than looking for solutions without a defined target. Second, every solution envisioned is ultimately an experiment. Its results can be measured against the target state. Thirdly: When creating the action plan, the participants can ask themselves whether the goal will be achieved in this way.
When working out the target situation, the following questions should also be answered:
- How do we measure whether the project was successful? And:
- What standard or basis (for example, ratio) do we use for comparison?
4. cause analysis The task now is to understand the causes of the current situation and to identify starting points for effective procedures. A proven method for root cause analysis is the Ishikawa diagram, which can be used to collect possible causes that bring about the problem at the "point of cause".
The aim is to identify the factors that have a direct influence on the actual problem.
5. countermeasures This lists the measures that can be used to eliminate the causes of the problem and improve the system. Countermeasures are (according to Toyota terminology) measures that eliminate the core cause and provide a permanent solution to the problem. It is important to name these clearly when listing them:
- "What" is the (partial) problem (or its cause) that the measure is intended to solve,
- "how" it will be investigated/resolved,
- "who" is responsible for the measure,
- "when" it will be executed and
- "where" is it performed?
6. success effect In this step, it is checked whether the countermeasures led to the planned result. In addition, in the event of a deviation from the target, the reasons for this are named. The impact achieved is quantified, with a graphical representation (before/after comparison) facilitating comprehensibility.
7. standardisation (and follow-up) During the follow-up, the overall process is evaluated. In addition, it is reflected which measures should be taken to secure and further advance the improvements achieved. The standardization of successful countermeasures raises the process to a higher level. The following questions, among others, must now be answered:
- What needs to be done to secure what has been achieved in the long term?
- To what other tasks/problems can we transfer our experience?
- Who should we tell about our experience so that other parts of the organisation can benefit from it?


